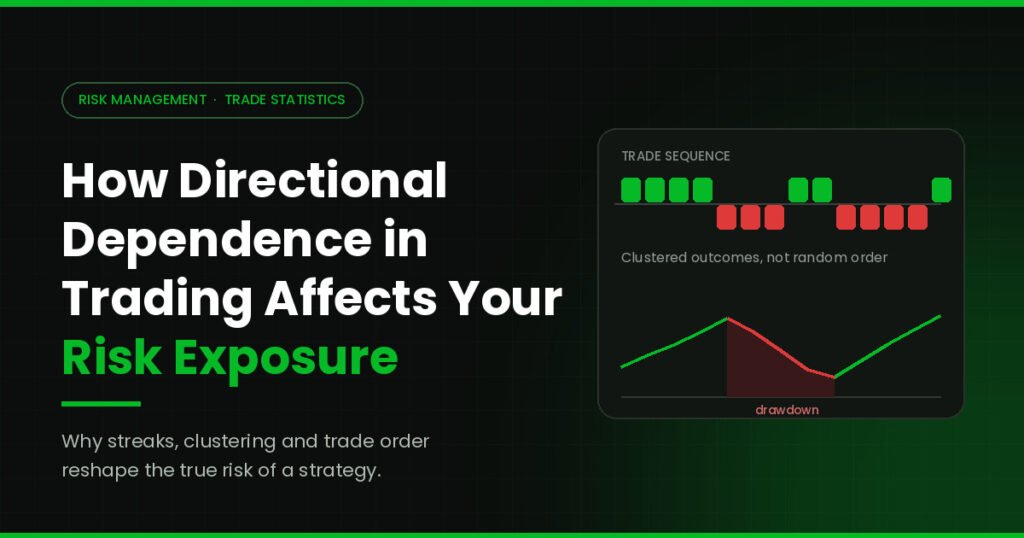
Most risk models begin with a quiet assumption. They assume every trade stands on its own. Markets, however, rarely behave that politely. Results often arrive in clusters, and those clusters reshape your equity curve.
That clustering has a name. Directional dependence in trading describes the tendency of one trade outcome to influence the next one. When it exists, wins follow wins and losses follow losses far more often than chance allows.
Over two decades of reviewing strategy reports, the same blind spot keeps appearing. Traders measure average risk with great care. Yet they ignore the order in which results arrive. As a result, live drawdowns shock them.
This guide explains the idea in plain language. It also covers directional dependence testing, the main tests to run, and the risk decisions that should follow.
What Directional Dependence in Trading Really Means
Think of your trade history as a sequence, not a pile. A pile has an average. A sequence has rhythm, memory, and streaks.
Directional dependence in trading exists when that sequence carries memory. In other words, the direction of your last result changes the odds for the next one. A strategy with 55% accuracy might still produce six losses in a row far more often than a coin would.
Statisticians call the opposite condition independence. Under independence, every trade resets the clock. Nothing carries over. Most textbook risk formulas quietly rely on that idea.
Real strategies break the rule constantly. Trend systems win during sustained moves and bleed during choppy weeks. Mean reversion systems do the reverse. Because market regimes persist, trade outcomes persist too.
Independence Is an Assumption, Never a Guarantee
Here is the practical point. Independence is something you should test, not something you should assume. Directional dependence in trading is common, measurable, and manageable once you look for it.
Why Risk Exposure Changes When Trades Depend on Each Other
Two strategies can share the same win rate, the same average win, and the same average loss. Still, one can ruin an account while the other survives. The difference sits in the sequence.
Drawdowns Grow Deeper and Last Longer
Independent losses spread out over time. Dependent losses bunch together. Consequently, your worst peak-to-trough decline expands well beyond what standard math predicts. Directional dependence in trading turns an uncomfortable dip into a serious threat.
A simple example helps. Imagine a system with a 40% loss rate. Under independence, five straight losses appear occasionally. Add mild directional dependence, and that same streak becomes routine. Your maximum drawdown might double, even though nothing else about the strategy changed.
Position Sizing Drifts Away From Its Target
Fixed fractional sizing, Kelly variants, and volatility targeting all lean on independence. Therefore, dependence quietly distorts them.
During a losing cluster, equity falls fast. Your risk per trade then falls too, so recovery slows. During a winning cluster, the opposite happens. Exposure climbs right before the streak breaks. That timing mismatch damages returns and raises risk at once. Directional dependence in trading therefore weakens the very models built to protect you.
Backtest Statistics Understate the Real Danger
Many performance reports summarise risk with averages and standard deviations. Those numbers hide clustering completely. So a backtest can look calm while the live account feels violent. Directional dependence in trading hides comfortably inside tidy summary statistics.
A Simple Way to Picture the Effect
Picture two jars of marbles. The first jar holds green and red marbles mixed evenly, and every draw is fresh. The second jar quietly adds a red marble each time you draw red.
The long-run ratio can look identical in both jars. The experience, though, feels completely different. The second jar hands you long red runs, and those runs are what empty a trading account.
Directional dependence in trading works exactly like that second jar. Your average statistics stay respectable. Meanwhile, the path becomes rougher, the recovery periods stretch, and the emotional pressure rises sharply.
Where Directional Dependence Comes From
Dependence is not a flaw in your data. Usually, directional dependence in trading reflects something real about markets or about your own process.
Market regimes create most of it. Volatility clusters, trends persist, and liquidity conditions linger for weeks. Any strategy tuned to one regime will therefore win and lose in blocks.
Overlapping positions add more. If three open trades share the same underlying driver, they behave as one position. The trade log records three results, yet the risk was singular.
Behaviour contributes as well. Traders widen stops after losses and press size after wins. Both habits inject dependence into an otherwise neutral system.
Finally, execution matters. Slippage worsens in stressed conditions, which tends to punish several trades at the same time.
Understanding the source is useful, not academic. Regime-driven dependence calls for a filter. Behaviour-driven dependence calls for stricter rules. Overlap-driven dependence calls for better exposure limits. Each cause therefore points toward a different fix.
Directional Dependence Testing: The Practical Starting Point
Measuring directional dependence in trading starts with clean data, not with clever formulas. Sloppy inputs produce confident nonsense.
Start with a clean, time-ordered trade list. Each row needs an entry time, an exit time, and a signed result. Next, convert results into a simple binary sequence of wins and losses. Many statistical tests for trade direction work on that sequence alone.
Sample size matters a great deal. Fewer than 100 trades rarely supports a firm conclusion. Around 300 trades gives reasonable power. Above 500, patterns become much easier to trust.
Also decide how to treat scratch trades. Small breakeven results can distort short sequences, so most analysts remove them or classify them consistently.
Finally, separate the sample. Run testing directional dependence on in-sample data first, then repeat it on unseen data. Agreement across both sets means far more than a single impressive p-value.
Statistical Tests for Trade Direction Worth Running
Several practical directional dependence tests for trading strategies exist. Each one answers a slightly different question about directional dependence in trading, so combining them works best.
The Runs Test
The Wald–Wolfowitz runs test counts unbroken streaks in your win-loss sequence. It then compares that count with the number expected from random ordering.
Too few runs signal clustering. Too many runs signal alternation, which appears in some mean reversion systems. This test is fast, intuitive, and a sensible first step when you screen for directional dependence in trading.
Autocorrelation and the Ljung–Box Test
Autocorrelation measures how strongly a value relates to earlier values. Applied to trade returns, it reveals memory at specific lags.
The Ljung–Box test then checks several lags at once. Because it examines the whole pattern rather than one lag, it catches subtle structure that a single correlation coefficient misses.
Markov Transition Analysis
A first-order Markov model estimates the probability of a win given a previous win, and of a loss given a previous loss. Those transition probabilities describe dependence directly.
Compare them with your unconditional win rate. A meaningful gap confirms directional dependence in trading, and it also tells you which direction persists.
Block Bootstrap and Permutation Tests
Permutation tests shuffle your trade order thousands of times. Each shuffle destroys sequence memory while keeping the same trades. You then compare your real maximum drawdown against the shuffled distribution.
Block bootstrapping goes further. It resamples chunks of trades instead of single trades, so streaks survive. As a result, it produces far more honest drawdown estimates for dependent sequences.
Regime Conditioning
Finally, split results by volatility, session, or trend filter. Sometimes dependence disappears inside each regime and only appears in the combined series. That insight changes your response completely.
No single method settles the question. Consequently, experienced analysts run two or three directional dependence tests for trading strategies and look for agreement between them.
How to Read the Results Without Fooling Yourself
Statistical output invites overconfidence. Read it slowly instead.
First, treat p-values as evidence, not verdicts. A borderline result on 120 trades proves very little. Moreover, running many statistical tests for trade direction on the same data will eventually produce a false positive.
Second, focus on effect size. A transition probability that shifts from 55% to 58% is technically detectable yet practically minor. A shift to 70% demands action.
Third, look for stability. Genuine dependence persists across years, symbols, and market conditions. Fragile dependence appears in one window and vanishes in the next.
Fourth, remember the direction of the finding. Positive dependence deepens drawdowns. Negative dependence smooths them, though it can still distort compounding.
Fifth, document your process. Write down the sample, the method, and the threshold before you look at results. That habit keeps testing directional dependence honest, because it removes the temptation to reinterpret weak findings after the fact.
Turning Test Results Into Better Risk Control
Measurement only matters when it changes behaviour. Once directional dependence testing confirms clustering, several adjustments follow naturally. Each one adjusts your exposure to the sequence rather than to the average trade.
Size for the streak rather than the average trade. Ask what happens after eight consecutive losses, not after one. Then set risk per trade so that scenario stays survivable.
Add a cluster-aware exposure rule. Some traders halve size after a defined losing sequence and restore it only after conditions normalise. This approach accepts slower recovery in exchange for a shallower hole.
Cap correlated exposure directly. If several open trades share one driver, count them as one risk unit. Doing so removes a large share of artificial dependence immediately.
Replace naive drawdown estimates with block bootstrap figures. Those numbers reflect clustering, so they set far more realistic limits.
Review the analysis on a schedule. Markets evolve, and yesterday’s dependence structure will not last forever. Quarterly reviews keep the picture current without inviting constant tinkering.
Does Directional Dependence Always Hurt You?
Not always. The effect is neutral until your risk rules meet it.
Negative dependence, where wins tend to follow losses, actually smooths equity curves. Traders with that profile often tolerate slightly larger position sizes safely.
Positive dependence is the dangerous version, yet even it carries useful information. If losses cluster inside a known regime, a simple filter can remove much of the damage. Some traders instead pause after a defined losing sequence and resume once conditions change.
The real problem is unmeasured dependence. Directional dependence in trading only becomes destructive when your sizing model pretends it does not exist. Once measured, it turns into an ordinary input, much like volatility or correlation.
Common Mistakes During Directional Dependence Testing
Small errors undermine good intentions. Watch for these first.
Testing on tiny samples tops the list. Thirty trades cannot reveal sequence structure reliably.
Ignoring trade overlap comes next. Simultaneous positions inflate apparent dependence because they duplicate one decision.
Confusing correlation with causation follows closely. A streak explains itself through regime persistence far more often than through some hidden edge.
Some traders also test only once. Because conditions shift, a single study ages quickly.
Finally, many analysts stop at the p-value. Numbers without a risk decision attached deliver no value whatsoever.
Final Thoughts
Directional dependence in trading is not an academic curiosity. It sits at the centre of the gap between backtest comfort and live discomfort. Strategies fail through sequence far more often than through a weak average edge.
The remedy is refreshingly practical. Test your trade sequence, measure the size of the effect, and size positions for the clusters you actually experience. Above all, treat independence as a claim requiring proof.
Traders who study their own data honestly tend to survive far longer than those who chase higher win rates. At GainzAlgo, we believe that mindset separates durable trading from lucky trading, and we encourage every trader to examine their sequence before their averages.